Chief Medical Officer (CMO) Compensation in Non-Profit Organizations
Darcy Devine • April 25, 2016
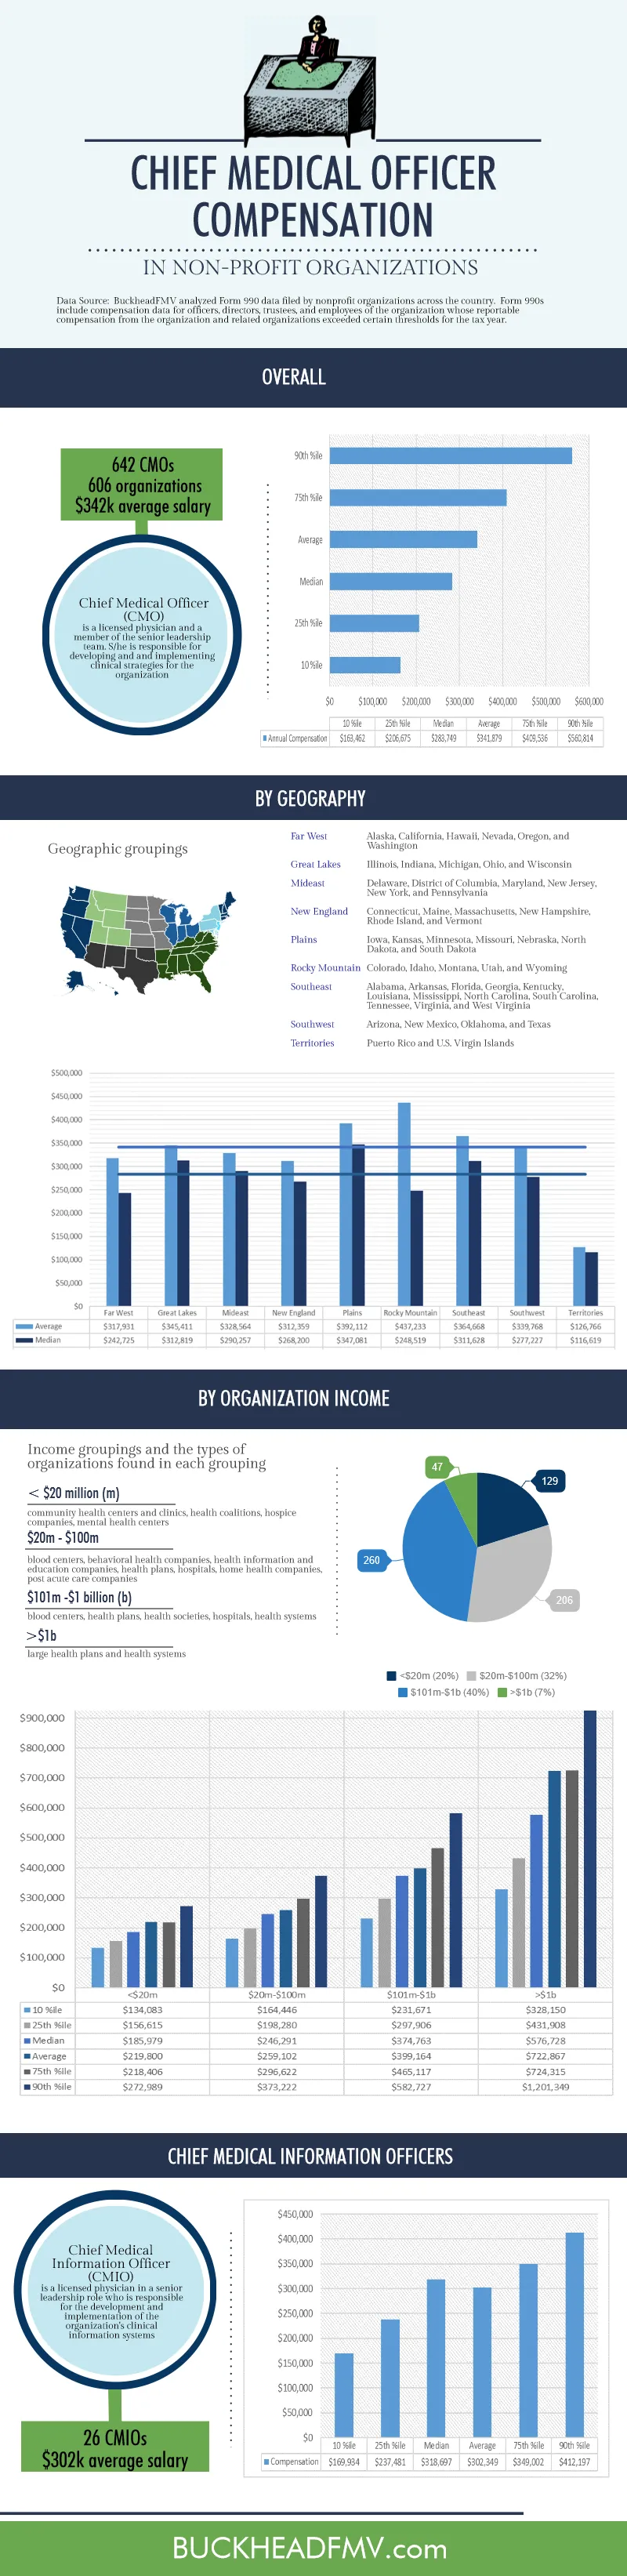
The title "Chief Medical Officer" appears to be far more commonplace today than it was a decade or so ago. Back then, organizations seemed to be less consistent in the titles they gave to their physician leaders. If nothing else, elevating top clinicians to the C-Suite, and letting seemingly equivalent titles like "VP of Medical Affairs" and "Physician in Chief" go by the wayside, makes compensation benchmarks for these physicians easier to find.
In our study of officers and employees in nonprofit organizations, BHA identified 642 physicians with the title of Chief Medical Officer (CMO). Median compensation for CMOs was $284,000 per year. Average compensation was $342,000 per year. We saw significant differences between salaries in smaller and larger organizations. Average CMO compensation was $220,000 in organizations with less than $20 million in annual income and $723,000 in organizations with more than $1 billion in annual income.
Our study also focused on compensation for Chief Medical Information Officers (CMIOs). A CMIO is a physician leader who has the responsibility of developing and implementing an organization's clinical information systems. We found twenty-six (26) physicians with the title of CMIO. These individuals had average compensation of just over $302,000 per year.
See the infographic below for more of our findings.

We ranked the 30 largest healthcare services and information technology deals of 2018, according to our database, by valuation multiple. The lowest reported price to EBITDA multiples (10x or lower, sorted alphabetically) are listed below.

We ranked the 30 largest healthcare services and information technology deals of 2018, according to our database, by valuation multiple.

We ranked the 30 largest healthcare services and information technology deals of 2018, according to our database, by valuation multiple. The highest reported price to EBITDA multiples (15x or higher, sorted alphabetically) were as follows:

Healthcare services organizations rely on a variety of intangible assets to create business value, including patient and customer relationships, medical records, trade names, assembled workforce, licenses and certifications, non-compete clauses, proprietary technology, software, and others.

For those of you who’ve been involved in a transaction where the only asset transferred is a certificate of need, you’ve probably found that market data is scarce for CON-only deals.

CON Laws, Scope of Practice Restrictions, and Provider Non-Compete Clauses Targeted in New Trump Adm
On Monday, December 3, 2018, the Department of Health and Human Services (HHS) – in collaboration with the Departments of the Treasury and Labor, the Federal Trade Commission, and several offices within the White House – released a report detailing recommendations for improving choice and competition in the healthcare industry.

One of the questions we get asked a lot is how valuations have changed over time.

One of the many benefits of tracking healthcare transactions closely and maintaining a very large database of deals where we can get reliable price to EBITDA and revenue multiples is that it provides insight into profit margins for segments where other financial benchmarking information is sparse.

The most important component of a valuation of an accountable care organization (or other multi-provider network that relies on risk-based shared savings models) is the revenue forecast, which involves “probability-adjusting” future shared savings payments in some manner.

CMS' offers a helpful online tool that shows provider market saturation levels at the national-, state-, and county-levels for the following health services: