Blog Layout

Valuing ACOs: Weighing the Probability of Shared Savings

Will Hamilton • November 16, 2018
The most important component of a valuation of an accountable care organization (or other multi-provider network that relies on risk-based shared savings models) is the revenue forecast, which involves “probability-adjusting” future shared savings payments in some manner.

Under the Medicare Shared Savings Program (MSSP), an ACO that meets its minimum savings rate (MSR) is entitled to a percentage of the total savings below its financial benchmark, which typically amounts to millions of dollars annually. Meanwhile, an ACO that misses its MSR by $1 gets nothing. Some ACO’s assume downside risk, meaning they have accepted the very real possibility of generating negative revenue in any given year. This structure makes ACOs very different from other healthcare organizations and forces the valuator to make probability adjustments when projecting the ACO’s future shared savings revenue.

BFMV has developed a calculator for probability-adjusting ACO revenue that factors in a normal level of fluctuation in health expenditures for a typical ACO population. Instead of getting into the theory behind the calculator, which we’ll cover in a future post (hint: it’s an option pricing model), here are a few scenarios to help explain how the calculator works.

Scenarios

1) The first scenario is a two-sided ACO model where there’s no MSR (MSR of 0%), which is basically the NextGen ACO model (despite the name, it’s the simplest model). We have also assumed that both the base case projected medical expenditures and the financial benchmark are the same ($10,000). In this scenario, the probability-adjusted upside ($180) is identical to the downside (-$180), so the probability-adjusted revenue is zero. ​​​​​

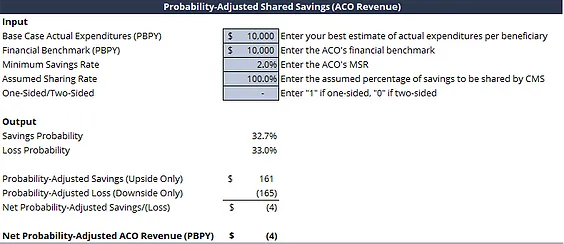
2) If we add an MSR of 2% to the same scenario, the upside, again, is almost identical to the downside, although both are lower due to some probability of the savings rate falling within the risk corridor where none of the savings/loss is shared.​​

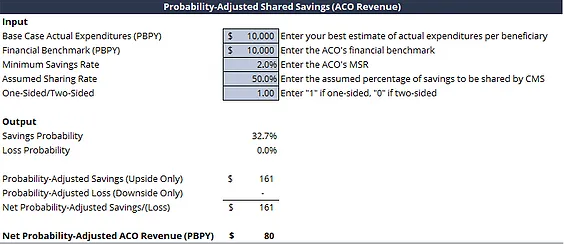
3) Next, if we switch to a one-sided Track 1 MSSP model with a 50% sharing rate, the results look much better ($80), because the possibility of downside loss is eliminated. Note that this figure is fairly similar to the average annual shared savings per beneficiary across the entire MSSP, which has been in the $80-90 range historically.​

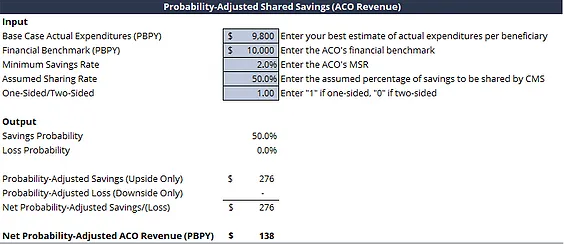
4) Where it gets interesting is if you change the base case estimate of actual expenditures for the ACO's attributed population. If your ACO is confident it can reduce expenditures by 2.0% against the benchmark ($9,800) as a base case scenario (still subject to a normal level of annual fluctuation), the probability-adjusted shared savings look quite a bit better, for obvious reasons.​

5) However, the optimal option at that point, from a purely-quantitative risk-agnostic standpoint, is to convert to the NextGen model described in scenario 1 where you assume two-sided risk, eliminate the MSR, and receive 100% of the savings or loss. In this scenario, there's still a significant chance of realizing a loss in any given year (32.7%), but the probability-adjusted upside ($295) far outweighs the downside risk (-$95), and the net probability-adjusted ACO revenue is quite a bit higher than in the Track 1 model (scenario 4).​
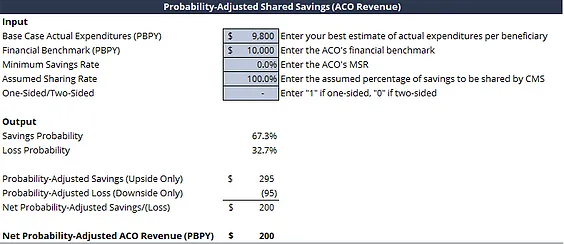
Utility


While the calculator was developed to value ACOs, which we’ve done for a variety of purposes such as mergers and acquisitions, joint ventures, minority investor buy-in/buy-out, and even tax purposes, we think it also may have some utility for ACO executives deciding which of the various financial models to select.


We’re happy to share the model with anyone, just email me at whamilton@buckheadfmv.com and I’ll send you a copy. We also welcome any questions or feedback.

Hand Touching Plus
By Will Hamilton February 11, 2019
We ranked the 30 largest healthcare services and information technology deals of 2018, according to our database, by valuation multiple. The lowest reported price to EBITDA multiples (10x or lower, sorted alphabetically) are listed below.
Man touching gears.
By Will Hamilton January 8, 2019
We ranked the 30 largest healthcare services and information technology deals of 2018, according to our database, by valuation multiple.
Business man
By Will Hamilton January 8, 2019
We ranked the 30 largest healthcare services and information technology deals of 2018, according to our database, by valuation multiple. The highest reported price to EBITDA multiples (15x or higher, sorted alphabetically) were as follows:
Man holding brain
By Will Hamilton January 3, 2019
Healthcare services organizations rely on a variety of intangible assets to create business value, including patient and customer relationships, medical records, trade names, assembled workforce, licenses and certifications, non-compete clauses, proprietary technology, software, and others.
Certified stamp
By Will Hamilton December 14, 2018
For those of you who’ve been involved in a transaction where the only asset transferred is a certificate of need, you’ve probably found that market data is scarce for CON-only deals.
United States Department of Health and Human Services
By Darcy Devine December 4, 2018
On Monday, December 3, 2018, the Department of Health and Human Services (HHS) – in collaboration with the Departments of the Treasury and Labor, the Federal Trade Commission, and several offices within the White House – released a report detailing recommendations for improving choice and competition in the healthcare industry.
Model posing
By Will Hamilton November 26, 2018
One of the questions we get asked a lot is how valuations have changed over time.
Medical heart
By Will Hamilton November 19, 2018
One of the many benefits of tracking healthcare transactions closely and maintaining a very large database of deals where we can get reliable price to EBITDA and revenue multiples is that it provides insight into profit margins for segments where other financial benchmarking information is sparse.
Market saturation and utilization map
By Darcy Devine October 31, 2018
CMS' offers a helpful online tool that shows provider market saturation levels at the national-, state-, and county-levels for the following health services:
Change and a stethoscope
By Will Hamilton and Darcy Devine September 17, 2018
Earlier this year, radiation therapy provider SightLine Health reached a $11.5m settlement with the DOJ in a lawsuit alleging it knowingly violated the federal physician self-referral and anti-kickback laws.
Show More
Share by: