Hourly Rates for Emergency Medicine Physicians: The Denominator Issue
Darcy Devine • August 16, 2016

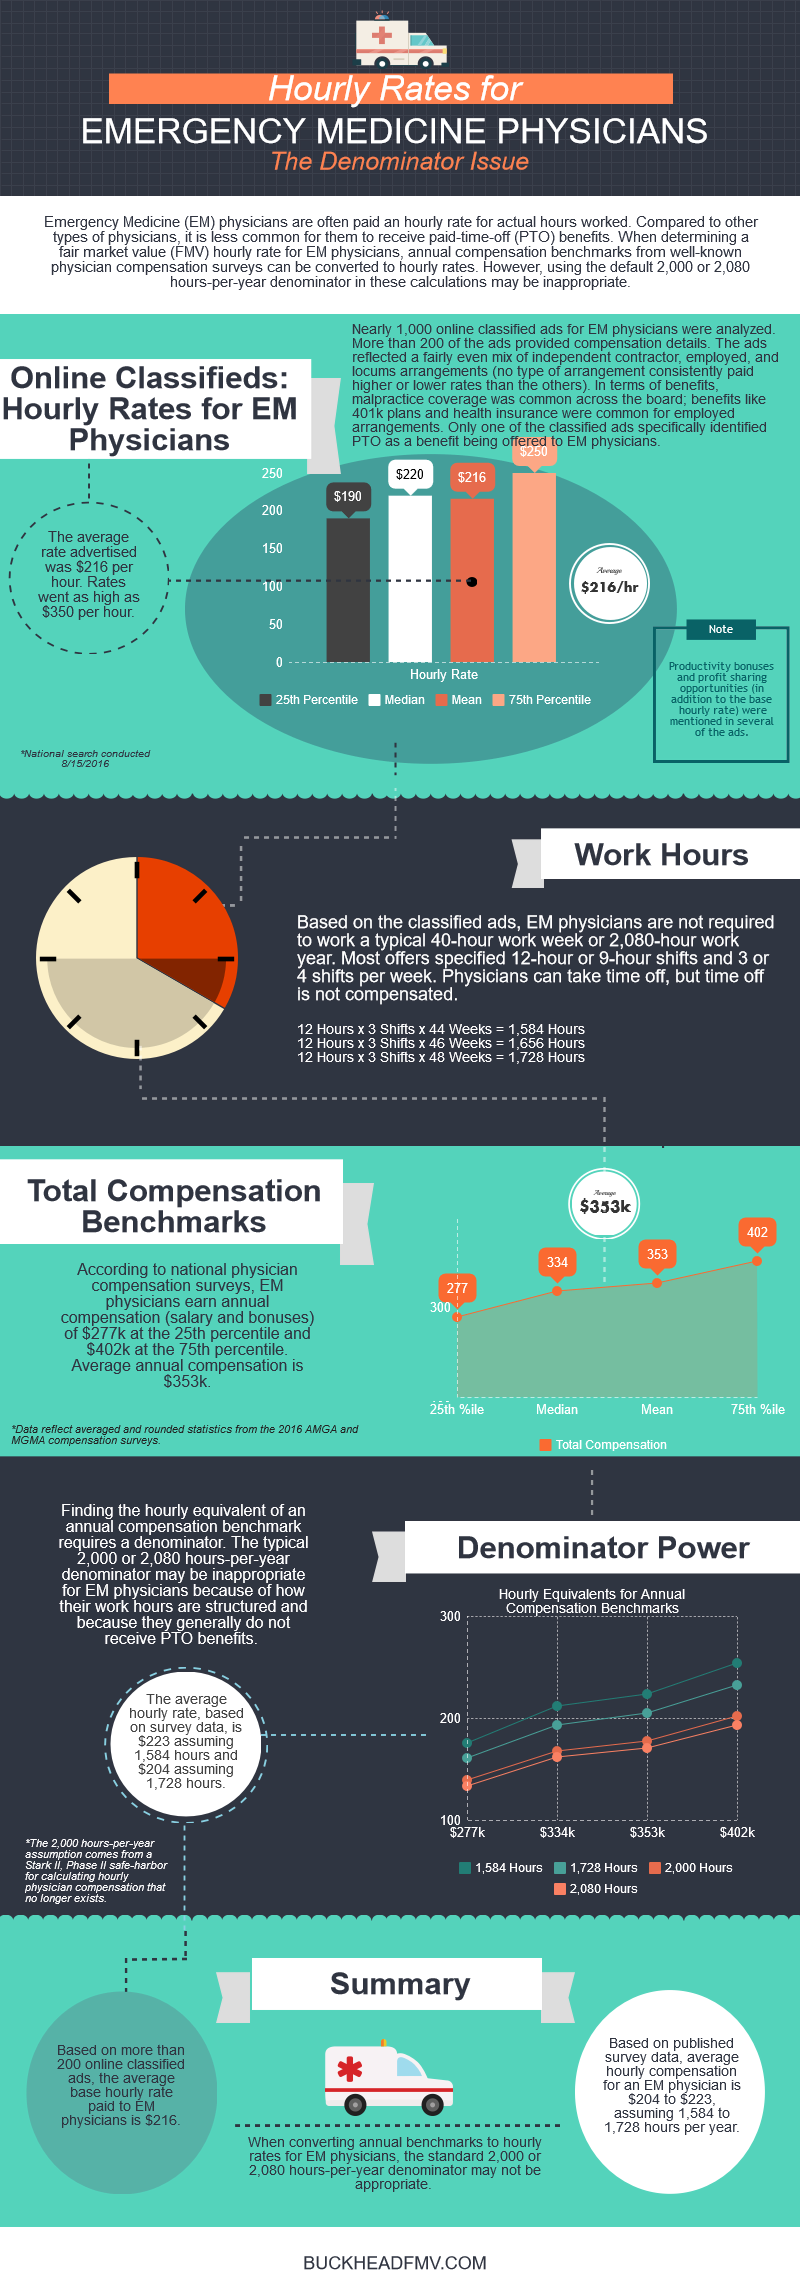
Emergency Medicine (EM) physicians are often paid an hourly rate for actual hours worked. Compared to other types of physicians, it is less common for them to receive paid-time-off (PTO) benefits. When determining a fair market value (FMV) hourly rate for EM physicians, annual compensation benchmarks from well-known physician compensation surveys can be converted to hourly rates. However, analysts and appraisers often default to a 2,000 or 2,080 hours-per-year denominator for these calculations, which may be inappropriate when it comes to EM physicians.
As shown in the infographic, based on a study of more than 1,000 online classified ads (200 of the ads included compensation terms), the average rate being offered to EM physicians across the country is $216 per hour. This finding is consistent with compensation statistics reported in well-known physician compensation surveys IF the survey data, expressed as a total annual compensation amount, is converted to an hourly rate using a denominator of between 1,584 and 1,728 hours. Using this denominator range, the analyst or appraiser is assuming EM physicians average fewer than 40 hours per week and do not receive paid vacation, sick, or holiday time, consistent with the terms found in the online classified ads. (Click on infographic for a PDF copy.)

We ranked the 30 largest healthcare services and information technology deals of 2018, according to our database, by valuation multiple. The lowest reported price to EBITDA multiples (10x or lower, sorted alphabetically) are listed below.

We ranked the 30 largest healthcare services and information technology deals of 2018, according to our database, by valuation multiple.

We ranked the 30 largest healthcare services and information technology deals of 2018, according to our database, by valuation multiple. The highest reported price to EBITDA multiples (15x or higher, sorted alphabetically) were as follows:

Healthcare services organizations rely on a variety of intangible assets to create business value, including patient and customer relationships, medical records, trade names, assembled workforce, licenses and certifications, non-compete clauses, proprietary technology, software, and others.

For those of you who’ve been involved in a transaction where the only asset transferred is a certificate of need, you’ve probably found that market data is scarce for CON-only deals.

CON Laws, Scope of Practice Restrictions, and Provider Non-Compete Clauses Targeted in New Trump Adm
On Monday, December 3, 2018, the Department of Health and Human Services (HHS) – in collaboration with the Departments of the Treasury and Labor, the Federal Trade Commission, and several offices within the White House – released a report detailing recommendations for improving choice and competition in the healthcare industry.

One of the questions we get asked a lot is how valuations have changed over time.

One of the many benefits of tracking healthcare transactions closely and maintaining a very large database of deals where we can get reliable price to EBITDA and revenue multiples is that it provides insight into profit margins for segments where other financial benchmarking information is sparse.

The most important component of a valuation of an accountable care organization (or other multi-provider network that relies on risk-based shared savings models) is the revenue forecast, which involves “probability-adjusting” future shared savings payments in some manner.
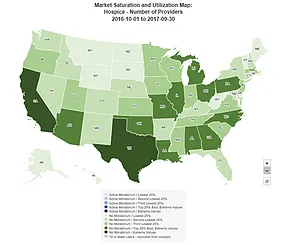
CMS' offers a helpful online tool that shows provider market saturation levels at the national-, state-, and county-levels for the following health services: