Valuing Physician-Performed NP & PA Supervisory Services
Darcy Devine • March 19, 2017

Medical practice owners have many reasons for wanting to add nurse practitioners (NPs) and physician assistants (PAs) to their staff. These providers help improve access to healthcare and can enhance the profitability of a medical practice. Although the country is moving toward autonomy and full practice authority for PAs and NPs, every state in the U.S. currently requires that PAs have some type of collaboration arrangement with a supervising physician. Many states require formal arrangements between NPs and supervising physicians, as well.
Getting a physician to supervise a PA or NP doesn’t seem like it should be an issue for a medical practice owner who employs physicians. However, depending on how her compensation arrangement is structured, an employed physician may have little financial motivation to supervise an NP or a PA. This is because employed physicians’ salaries and bonuses are often based solely on personal productivity – how many patients they see or how many wRVUs they personally generate determine their pay. Employed physicians don’t get credit for, or a percentage of, their nurse practitioners’ or assistants’ encounters or wRVUs.
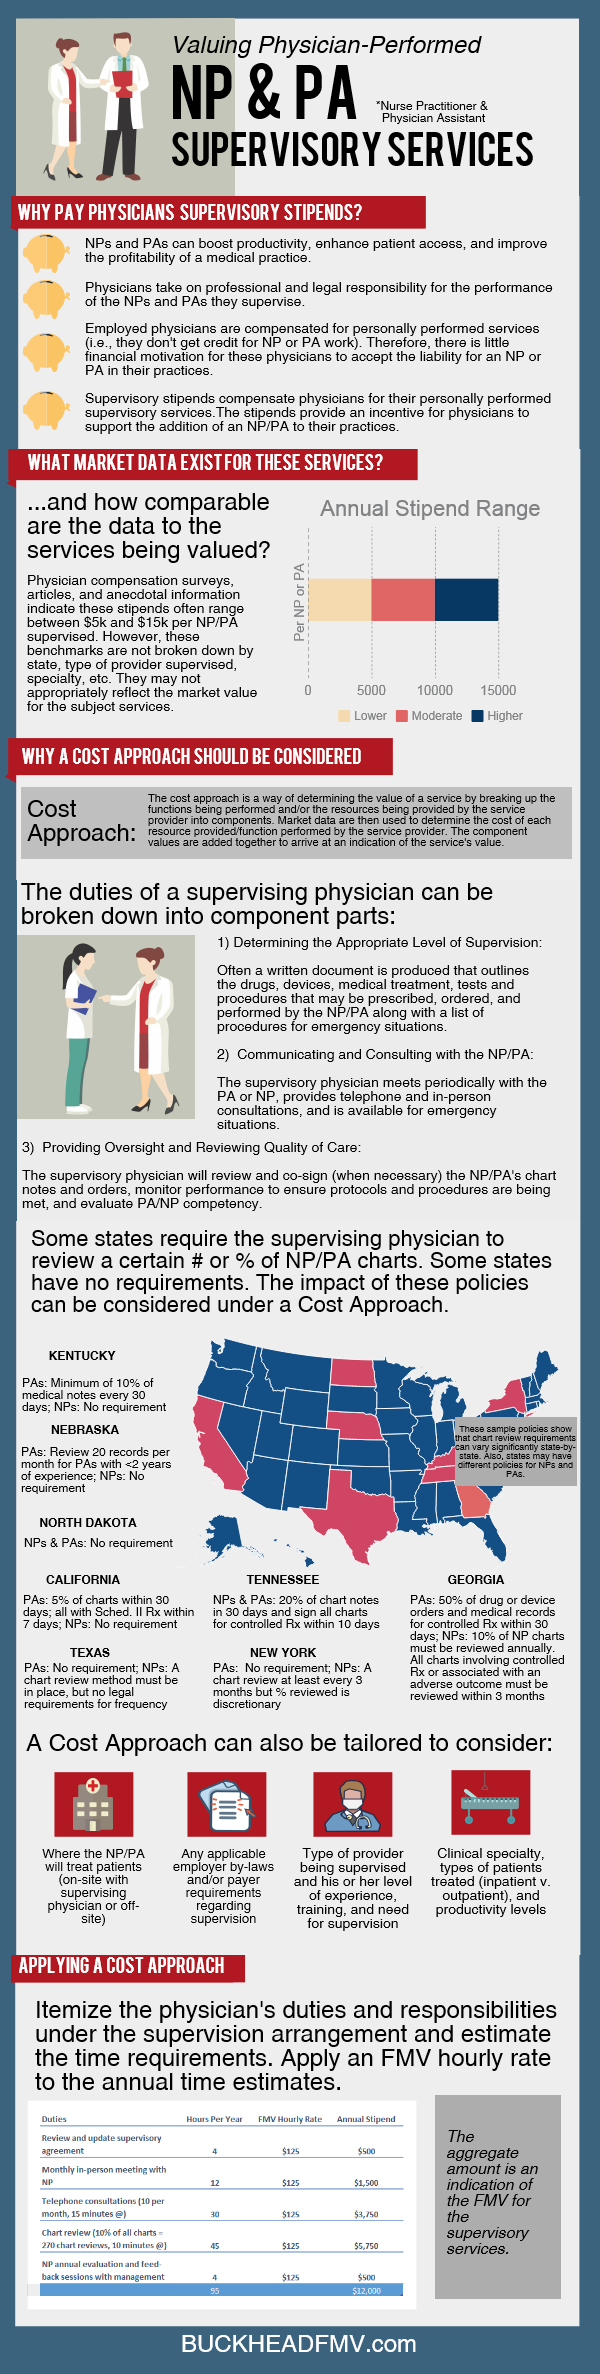
Since there is real work to be done under a supervisory arrangement, and real legal and professional risk involved for the physician, many employers pay physicians stipends to supervise NPs or PAs. These stipends compensate physicians for the time and effort they spend personally providing supervision services, such as determining practice procedures and protocols; meeting and consulting with the NP or PA; chart reviews and sign-offs; and evaluating professional competency.
Market data show that these stipends often range between $5,000 and $15,000 per year. The information, however, is very limited and provides no insight into the state-by-state requirements for supervising arrangements or the different requirements for NPs versus PAs. Moreover, it doesn’t touch on the specific obligations insurers and organizational by-laws may place on supervising physicians.
Without better data, using a market approach is a one-size-fits-all valuation technique that doesn’t make much sense given the heterogeneity of supervisory arrangements across the country. For example, it is hard to say that a national range equally applies to supervisory stipends in states that require physicians to review 20% of a PA’s or NP’s charts and in states that require no such review.
Using a cost approach seems to hold more water than the market approach when it comes to NP/PA supervisory stipends. The cost approach involves breaking down the supervising physician’s responsibilities and duties into component activities and estimating the hours required (at this point, the appraiser can consider the various state, payer, and organizational requirements that apply). A fair market value hourly rate, given the physician specialty and the intensity/effort involved, is then applied to the hours. The aggregated amount is an indication of the value of the services. (See the infographic for more details.)
The cost approach is a more tailored and precise approach to valuing NP/PA supervisory services than the market approach. And, although there is more legwork involved, the findings may be enlightening – you many find a specific arrangement requires a lot more or a lot less physician work than you thought. On the other hand, you may find additional support for a stipend that is already being paid. Either way, the cost approach is a worthwhile exercise and something for physician employers and healthcare valuation experts to consider when valuing NP/PA supervisory services.

We ranked the 30 largest healthcare services and information technology deals of 2018, according to our database, by valuation multiple. The lowest reported price to EBITDA multiples (10x or lower, sorted alphabetically) are listed below.

We ranked the 30 largest healthcare services and information technology deals of 2018, according to our database, by valuation multiple.

We ranked the 30 largest healthcare services and information technology deals of 2018, according to our database, by valuation multiple. The highest reported price to EBITDA multiples (15x or higher, sorted alphabetically) were as follows:

Healthcare services organizations rely on a variety of intangible assets to create business value, including patient and customer relationships, medical records, trade names, assembled workforce, licenses and certifications, non-compete clauses, proprietary technology, software, and others.

For those of you who’ve been involved in a transaction where the only asset transferred is a certificate of need, you’ve probably found that market data is scarce for CON-only deals.

CON Laws, Scope of Practice Restrictions, and Provider Non-Compete Clauses Targeted in New Trump Adm
On Monday, December 3, 2018, the Department of Health and Human Services (HHS) – in collaboration with the Departments of the Treasury and Labor, the Federal Trade Commission, and several offices within the White House – released a report detailing recommendations for improving choice and competition in the healthcare industry.

One of the questions we get asked a lot is how valuations have changed over time.

One of the many benefits of tracking healthcare transactions closely and maintaining a very large database of deals where we can get reliable price to EBITDA and revenue multiples is that it provides insight into profit margins for segments where other financial benchmarking information is sparse.

The most important component of a valuation of an accountable care organization (or other multi-provider network that relies on risk-based shared savings models) is the revenue forecast, which involves “probability-adjusting” future shared savings payments in some manner.
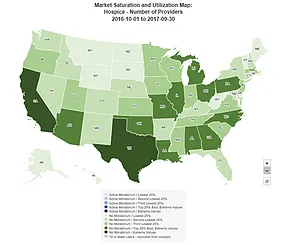
CMS' offers a helpful online tool that shows provider market saturation levels at the national-, state-, and county-levels for the following health services: