Valuing the Physician Hour - Converting Annual Compensation Data to Hourly Rates

Guidance for Converting Annual Compensation to Hourly Rates
The National Standard
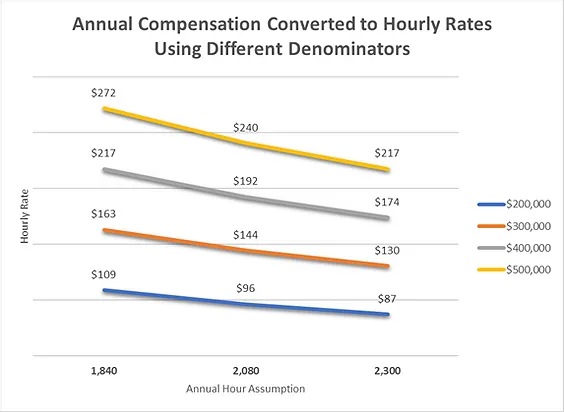
Per the Office of Personnel Management, for the purpose of calculating the hourly rates of pay for Federal civilian employees, the national standard in the United States is 2,087 hours per year. Prior to 1984, the divisor was 2,080, which assumes a 52-week year and a 40-hour workweek. However, a General Accounting Office study in 1981 study showed that, because some years have 366 days, over a 28-year period (the time it takes for the calendar to repeat itself), there are an average of 2,087 work hours per calendar year.
While the physician archetype is that of a sleep deprived professional working “long, irregular, and overnight hours,” on average, physicians work about the same number of hours as other full-time employees. Gallup data from 2013 and 2014 Work and Education Polls show that full-time adult workers in the United States work an average of 47 hours per week. Nearly 40% say they work at least 50 hours per week. This matches data from recent studies on physician work and lifestyles which show most physicians work 40 to 60 hours per week.
If physicians put in the same number of hours as other full-time employees, it makes sense that the national standard of 2,087 hours per year can be used to convert annual physician compensation data to hourly rates. It is important to note that many employers provide their employees with some amount of paid time off. So, a 2,087 denominator may result in too low of an hourly rate when working with certain specialists like emergency medicine physicians, who typically do not receive paid time off.
Stark Phase II
In 2004, CMS published Phase II of the federal physician self-referral prohibition (the Stark Law). Phase II created a ‘‘safe harbor’’ provision in the definition of ‘‘fair market value’’ at §411.351 for hourly payments to physicians for their personal services. The safe harbor consisted of two methodologies for calculating hourly rates that would be deemed ‘‘fair market value’’ for purposes of section 1877 of the Act.
One of the methodologies called for averaging the 50th percentile national compensation level for physicians in the same specialty, using at least four of six specified salary surveys, and dividing the result by 2,000 hours to establish an hourly rate. If the relevant physician specialty did not appear in one of the recognized surveys, the parties were required to use the survey’s reported compensation for general practice in order to be within the safe harbor based on this method.
The safe harbor methodology identified 2,000 hours as the appropriate denominator for determining an hourly rate. The safe harbor was repealed in 2007 when the Phase III regulations were issued. However, the approach and the 2,000 hours standard are still commonly used by many participants in the healthcare industry.
Specialty-Specific Studies and Surveys
In certain cases, a denominator tailored to the subject position may be developed by reviewing data from studies that provide more granular, specialty-specific information regarding standard work hours. These benchmarks are sometimes produced by societies or associations in connection with compensation studies or practice profiles conducted for their specialties.
Examples of specialty-specific studies and surveys include:
Society of Hospital Medicine, State of Hospital Medicine Survey
American Academy of Orthopaedic Surgeons, Orthopaedic Census Report
College of American Pathologists, CAP Practice Characteristics Study
American Academy of Family Physicians, Practice Profile Survey
American Academy of Dermatology, Dermatology Practice Profile Survey
ACEP/Daniel Stern, Emergency Medicine Compensation & Benefit Surveys (Discontinued in 2016)
Best Practices and Important Considerations to Make When Calculating Hourly Rates
Given the impact the annual hours assumption has on a calculated hourly rate, the following practices are prudent when converting annual compensation to hourly equivalents.
1. Assess the numerator to ensure physicians responding to the survey are providing services comparable to the ones being valued. Not all services have the same value, even when they are performed by the same physician. The same hourly rate may be used to compensate physicians for both administrative and clinical work only when the rate paid for clinical work is fair market value for the clinical work performed and the rate paid for administrative work is fair market value for the administrative work performed. CMS has noted in Phase III comments that the fair market value of administrative services may differ from the fair market value of clinical services.
2. Ensure that the annual physician compensation data reflects compensation for full-time equivalents. If the data does not reflect full-time work, adjust the denominator appropriately.
3. Consider whether the position being evaluated offers compensated holiday, vacation, and/or sick days (i.e., PTO). If physicians will be paid only for actual hours worked, consider a denominator that reflects actual work hours for a full-time physician.
4. Research how many hours physicians in the specialty typically work in a year. Determine if the denominator needs to reflect lower or higher-than-standard work hours.
5. Check the calculated results against data from available sources reporting rates on an hourly basis. These most commonly include surveys for medical director/administrative services. There are also surveys for locum physicians that work on a fee-for-time basis (see Buckhead FMV's 2017 Cost of Physician Staffing Services), although care must be taken to appropriately interpret the services and resources being purchased in these arrangements.
6. Often there is no clearly best divisor. In the absence of reliable, specialty-specific data, using a 2,000 hours denominator, consistent with the rescinded Stark safe harbor, may be an appraiser's best option when converting annual physician compensation data to an hourly rate. With all matters involving physician compensation, however, the appropriate FMV conclusion will be dependent on the specific facts and circumstances of the individual arrangement at-hand.
Resources for Physician Work Hour Data
AMA Insurance 2014 Work/Life Profiles of Today’s U.S. Physician
AMA Insurance, a subsidiary of the American Medical Association, conducted a survey of physicians age 30 to 69. There were 4,950 responses. Key Findings: More than half of the physicians surveyed (62%) reported typically working 40 to 60 hours per week. Eighteen percent (18%) work 61 to 80 hours, and 5% work more than 80 hours. The remaining 14% work fewer than 40 hours.
Medscape Physician Compensation Report 2017
Medscape’s 2017 report includes responses from more than 19,200 physicians. As a part of its annual compensation survey, Medscape asks physicians about their typical work hours. Key Findings: Fifty-three percent (53%) of physicians provide 30 to 45 hours of patient care each week. Another 33% provide patient care for 46 or more hours. In addition to patient care time, more than half (57%) of the respondents spend another 10 hours or more per week working on administrative tasks. In its specialty-specific reports, Medscape also provides hours data for physicians in 27 specialties.
The Physicians Foundation 2016 Survey of America’s Physicians: Practice Patterns & Perspectives
The 2016 Physicians Foundation report includes responses from more than 17,200 physicians regarding an array of questions on their practice patterns and perspectives on the industry. Key Findings: Overall, physicians reported working a total of 52.63 hours per week, on average, including both clinical and non-clinical duties. Roughly half (49%) reported working between 41 and 60 hours per week, and another 31% reported more than 60 hours. In terms of physicians’ non-clinical paperwork duties, the average time reported was 11.26 hours per week.
Annual Work Hours Across Physician Specialties
In July 2011, researchers published a research letter in the Archives of Internal Medicine on the relative annual work hours (including all clinical, administrative, and other professional duties) of physicians in 41 specialties.
AAMC Careers in Medicine Website
The Association of American Medical Colleges (“AAMC”) website provides users with information regarding the average hours worked per week by physicians in a range of specialties based on data from various sources. It requires a subscription for non-academic users.
Medscape Compensation Reports by Specialty
Medscape’s specialty-specific reports provide data on the number of hours physicians reported spending each week seeing patients, and separately on paperwork and administration. For 2017, Medscape published individual reports on 27 specialties.


CON Laws, Scope of Practice Restrictions, and Provider Non-Compete Clauses Targeted in New Trump Adm