Blog Layout

Size-Adjusting Healthcare Services Market Multiples

Will Hamilton • August 27, 2018
As we wrote last week, larger healthcare services companies generally fetch higher valuation multiples – i.e. the purchase price represents a larger multiple of the EBITDA generated by the business. We presented a chart that includes data from health services transactions, and compares the valuation multiple to the size of the business acquired. Here’s the same chart limited to only home-based service businesses.

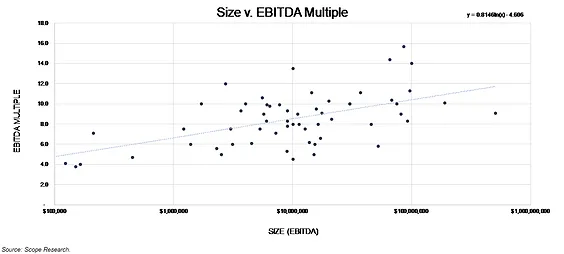
This week, we’ve also included the regression equation from the data that describes the relationship between size and valuation multiple (top right corner of the chart). This is the equation for the line that runs through the data set, and can be used to develop size-adjusted valuation multiples that represent “market” for the industry segment at various sizes, according to the sample. The table below includes market multiples from this sample at various sizes.

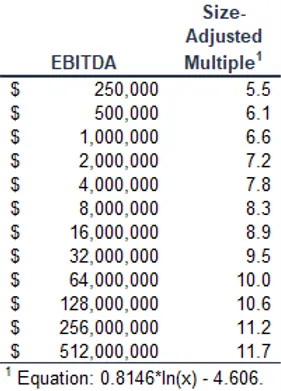
These size-adjusted market multiples are a starting point and a reasonableness check. Each business has different growth opportunities and risk factors, particularly in an industry as complex as healthcare. Factors such as diversity and sustainability of referral sources, out-of-network billing practices, regulatory risks, and capital intensity, among others, can all have a significant impact in specific situations.

Hand Touching Plus
By Will Hamilton February 11, 2019
We ranked the 30 largest healthcare services and information technology deals of 2018, according to our database, by valuation multiple. The lowest reported price to EBITDA multiples (10x or lower, sorted alphabetically) are listed below.
Man touching gears.
By Will Hamilton January 8, 2019
We ranked the 30 largest healthcare services and information technology deals of 2018, according to our database, by valuation multiple.
Business man
By Will Hamilton January 8, 2019
We ranked the 30 largest healthcare services and information technology deals of 2018, according to our database, by valuation multiple. The highest reported price to EBITDA multiples (15x or higher, sorted alphabetically) were as follows:
Man holding brain
By Will Hamilton January 3, 2019
Healthcare services organizations rely on a variety of intangible assets to create business value, including patient and customer relationships, medical records, trade names, assembled workforce, licenses and certifications, non-compete clauses, proprietary technology, software, and others.
Certified stamp
By Will Hamilton December 14, 2018
For those of you who’ve been involved in a transaction where the only asset transferred is a certificate of need, you’ve probably found that market data is scarce for CON-only deals.
United States Department of Health and Human Services
By Darcy Devine December 4, 2018
On Monday, December 3, 2018, the Department of Health and Human Services (HHS) – in collaboration with the Departments of the Treasury and Labor, the Federal Trade Commission, and several offices within the White House – released a report detailing recommendations for improving choice and competition in the healthcare industry.
Model posing
By Will Hamilton November 26, 2018
One of the questions we get asked a lot is how valuations have changed over time.
Medical heart
By Will Hamilton November 19, 2018
One of the many benefits of tracking healthcare transactions closely and maintaining a very large database of deals where we can get reliable price to EBITDA and revenue multiples is that it provides insight into profit margins for segments where other financial benchmarking information is sparse.
By Will Hamilton November 16, 2018
The most important component of a valuation of an accountable care organization (or other multi-provider network that relies on risk-based shared savings models) is the revenue forecast, which involves “probability-adjusting” future shared savings payments in some manner.
Market saturation and utilization map
By Darcy Devine October 31, 2018
CMS' offers a helpful online tool that shows provider market saturation levels at the national-, state-, and county-levels for the following health services:
Show More
Share by: