Blog Layout

ACO Results for Performance Year 2017: Top 4 Insights

Will Hamilton • September 3, 2018
CMS released performance year 2017 results in August for the Medicare Shared Savings Program (MSSP). It was definitely a big year for ACOs. The following is a list of key insights from this year’s data file.

The ACO Success Rate Increased
The percentage of ACOs that are successful is probably the most cited statistic related to the program. In PY 2017, 162 out of 472 ACOs in the MSSP beat their minimum savings rate (MSR) and achieved shared savings, representing a success rate of over 34 percent. This represents an acceleration of the improvements in previous years. There was an even larger jump in the ACO success rate when measured by total beneficiaries (i.e. the percentage of beneficiaries in a “successful” ACO), indicating that larger ACOs had more success in PY 2017.

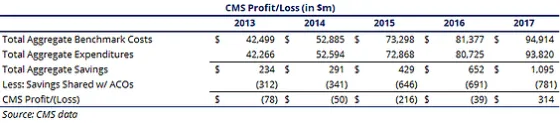
CMS Turned a Big Profit

For the first time ever, CMS clearly turned a profit in PY 2017 to the tune of about $314 million. A lot of time is spent discussing the total “gain” from the program, which is usually cited as the gain generated by successful ACOs. This measure excludes ACOs with higher costs than their benchmark. What matters to CMS is the total aggregate expenditure relative to the total aggregate benchmark, less the amount shared with ACOs.

It's worth noting that the CMS Office of the Actuary estimates that this simple approach understates the true impact of the program by as much as 60% due to spillover effect on non-assigned beneficiaries.


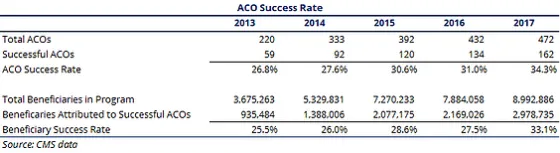
ACOs Performed About the Same On Average

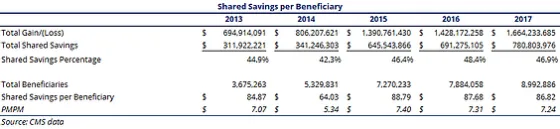
Despite the dramatic increase in success rate and improvement to the CMS bottom line, ACOs themselves actually performed about the same in terms of generating revenue. Total shared savings was $781m in PY 2017, or $86.82 per beneficiary, which was actually a slight decrease from PY 2016. The decline was due to a decrease in shared savings per beneficiary attributable to successful ACOs, meaning ACOs who exceeded their MSR did so by less (and a lower percentage of the total gain was shared by CMS as well, although this had less of an impact). These factors were off-set by the significant increase in the number of successful ACOs.

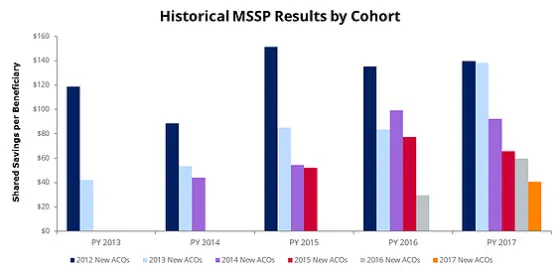
 Older ACOs Continue to Perform Better


  • For the first time, the 2013 cohort almost matched their 2012 counterparts in terms of shared savings per beneficiary. 
  • Like the 2013 cohort before them, the 2014 group’s performance declined in its fourth year in the program, as the benchmark reset at the beginning of a new contract. 
  • The 2015 cohort’s performance actually declined in year 3, after both the 2013 and 2014 vintages showed significant improvement in their third year. 
  • The 2016 cohort showed significant improvement in year 2, continuing a well-established trend. 
  • The new 2017 ACOs performed in line with previous new groups, on average, and significantly better than the unusually slow starting 2016 cohort.

Feel free to reach out if you have questions about the data or want to discuss any ACO-related valuation issues.

Hand Touching Plus
By Will Hamilton February 11, 2019
We ranked the 30 largest healthcare services and information technology deals of 2018, according to our database, by valuation multiple. The lowest reported price to EBITDA multiples (10x or lower, sorted alphabetically) are listed below.
Man touching gears.
By Will Hamilton January 8, 2019
We ranked the 30 largest healthcare services and information technology deals of 2018, according to our database, by valuation multiple.
Business man
By Will Hamilton January 8, 2019
We ranked the 30 largest healthcare services and information technology deals of 2018, according to our database, by valuation multiple. The highest reported price to EBITDA multiples (15x or higher, sorted alphabetically) were as follows:
Man holding brain
By Will Hamilton January 3, 2019
Healthcare services organizations rely on a variety of intangible assets to create business value, including patient and customer relationships, medical records, trade names, assembled workforce, licenses and certifications, non-compete clauses, proprietary technology, software, and others.
Certified stamp
By Will Hamilton December 14, 2018
For those of you who’ve been involved in a transaction where the only asset transferred is a certificate of need, you’ve probably found that market data is scarce for CON-only deals.
United States Department of Health and Human Services
By Darcy Devine December 4, 2018
On Monday, December 3, 2018, the Department of Health and Human Services (HHS) – in collaboration with the Departments of the Treasury and Labor, the Federal Trade Commission, and several offices within the White House – released a report detailing recommendations for improving choice and competition in the healthcare industry.
Model posing
By Will Hamilton November 26, 2018
One of the questions we get asked a lot is how valuations have changed over time.
Medical heart
By Will Hamilton November 19, 2018
One of the many benefits of tracking healthcare transactions closely and maintaining a very large database of deals where we can get reliable price to EBITDA and revenue multiples is that it provides insight into profit margins for segments where other financial benchmarking information is sparse.
By Will Hamilton November 16, 2018
The most important component of a valuation of an accountable care organization (or other multi-provider network that relies on risk-based shared savings models) is the revenue forecast, which involves “probability-adjusting” future shared savings payments in some manner.
Market saturation and utilization map
By Darcy Devine October 31, 2018
CMS' offers a helpful online tool that shows provider market saturation levels at the national-, state-, and county-levels for the following health services:
Show More
Share by: